Enterprise Mobility & the Connected Worker Blog
Behind the Research: 10 Tips for Survey Design
This post is the first in an upcoming short series of blogs called Behind the Research. Our Behind the Research series is intended to provide existing and potential clients with targeted insights into our some of our key methodological approaches pertaining directly to our data. While this series is by no means exhaustive, our Analysts will lend their expertise and provide tips on methodological topics of interest and relevance. If you have a topic which you would like to see covered in a future issue of Behind the Research, feel free to e-mail your suggestion to croche@vdcresearch.com or Tweet your suggestions to@VDC_Research.
Polls and surveys have the ability to provide significant insights into many areas of research and can often reveal hidden trends. Whether used in politics or market research, surveys provide analysts with vital data for forecasts, predictions, and cross-cutting analysis of their desired topic area. Many of VDC’s reports, whitepapers, and blog posts contain data provided from our custom designed surveys.
The nature of VDC surveys allow respondents to provide information from an anonymous, protected vantage point, giving them the ability to respond freely with information regarding markets, business structures, and other strategic details. However, before leveraging the capabilities of any survey, it should pass through rigorous planning stages to ensure that it is not only effective, but will also yield the best possible environment for accurate results. This design process further solidifies internal and external validity, ultimately reducing Type I and Type II errors in the following analytics process. While there are many strategies involved in survey design, this blog post will attempt to highlight 10 critical tips to keep in mind when designing your own survey.
- Outline First: Overall, when designing a survey, it’s best to create a rough outline of how your survey will flow, the logic, and the block organization before programming it into your desired survey platform (Qualtircs, Survey Monkey, etc.). This can save a lot of time during the revision process when changing blocks or re-order questions.
- Create Fair Questions: Know your audience and design questions to elicit a fair answer. A biased question will give you biased answers. Using leading questions or answers which clearly favor one response, will often result in heavily skewed and unreliable data. When using Likert scales try to avoid terms like “Always” and “Never” in favor of terms like “Not Very Much” or “Extremely”.
- Limit Response Options: Consider limiting the number of response options or design close-ended questions. If you have a multiple choice question which asks participants to “select all that apply” and give them a list of ten (or more) items to assess, you will likely receive watered down data points and might miss trends due to aggregation. In the case described above, respondents will generally select quite a few choices, but you can combat this through response control. If participants can only select 3 or 5 options, they will provide more accurate responses.
- Beware of Respondent Fatigue: If you have a HUGE question, sometimes it may be best to break it into a series of shorter ones. Participants will only give each question a certain amount of time before they become tired and move on. So, if you have a question followed by a long list of Likert scale items, or one which requires heavy reading, participants will probably tune-out about half way through due to fatigue. You can combat this phenomenon by making several shorter questions instead of one long question. Limiting response options will also help prevent respondent fatigue.
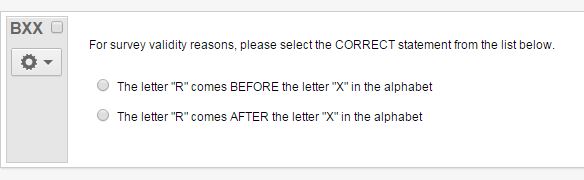
- Attention Checks: Always ask an attention check question. This will allow you to quickly purge any respondents who fail this basic test in the data cleaning phase of your project. You don’t have to hide this question; if people are not paying attention, then you don’t want them in your data anyways. Be sure to insert the attention check question(s) in the middle or end of your survey to catch satisficers or flatliners. You’ll be surprised at how many people actually fail a question as simple as this:
- Page Breaks: Be sure to put a page-break after lengthy questions or after two smaller back-to-back questions. Too much information or too many questions on any one page can easily overwhelm respondents and increase fatigue.
- Organize Questions: Put questions with the same theme or topic into the same block (organizational structure). This way, respondents answer all the pertinent questions regarding one topic at the same time. By focusing all of their attention onto one general topic at a time, they are able to provide more accurate responses. This organization will significantly help when using survey logic tools as well.
- Use Survey Logic: Use “skip logic” and “display logic” to map out your survey. This way, participants will only receive specifically applicable questions. Skip logic will allow you to skip a question if a respondent does not meet certain criteria. Display logic will allow you to only display a question if a respondent meets specific criteria. While these tools many not be needed on simple surveys, on a long more complex survey, logic coupled with organized questions can save a lot of programming time.
- Fore Validation: Remember to force respondents to answer questions which are essential to your data or which are important to the general flow of the survey. Any question which is dependent on skip or display logic should receive this treatment.
- Test Your Survey: ALWAYS test your survey! You essentially want to try to break your survey by being the worst respondent possible. This way you can catch any logic issues, organizational problems, or other errors which might be lurking before you launch to your actual target audience. Also, feel free to give it to co-workers and let them try to break it too!
Cameron Roche received a dual B.A. in psychology and government & law from Lafayette College and his M.A. in political science, specializing in political psychology, American politics, and polling/survey methodology, from the University of Massachusetts, Amherst. He previously served as Assistant Director for UMass Poll and as a Research Assistant for the Cooperative Congressional Election Survey (CCES). Be sure to look for future Behind the Research posts addressing other methodological aspects of survey work and data cleaning. The author can be contacted directly at croche@vdcresearch.com or via his Twitter @Cam_Roche.
View the 2017 Enterprise Mobility & Connected Devices Research Outline to learn more.